Metrics & Monitoring
HBase metrics system configuration, JMX monitoring, master and RegionServer metrics, and integration with monitoring tools.
HBase Metrics
HBase emits metrics which adhere to the Hadoop Metrics API. Starting with HBase 0.95[^1], HBase is configured to emit a default set of metrics with a default sampling period of every 10 seconds. You can use HBase metrics in conjunction with Ganglia. You can also filter which metrics are emitted and extend the metrics framework to capture custom metrics appropriate for your environment.
Metric Setup
For HBase 0.95 and newer, HBase ships with a default metrics configuration, or sink. This includes a wide variety of individual metrics, and emits them every 10 seconds by default. To configure metrics for a given region server, edit the conf/hadoop-metrics2-hbase.properties file. Restart the region server for the changes to take effect.
To change the sampling rate for the default sink, edit the line beginning with *.period. To filter which metrics are emitted or to extend the metrics framework, see https://hadoop.apache.org/docs/current/api/org/apache/hadoop/metrics2/package-summary.html
HBase Metrics and Ganglia
By default, HBase emits a large number of metrics per region server. Ganglia may have difficulty processing all these metrics. Consider increasing the capacity of the Ganglia server or reducing the number of metrics emitted by HBase. See Metrics Filtering.
Disabling Metrics
To disable metrics for a region server, edit the conf/hadoop-metrics2-hbase.properties file and comment out any uncommented lines. Restart the region server for the changes to take effect.
Enabling Metrics Servlets
HBase exposes the metrics in many formats such as JSON, prometheus-format through different servlets (/jmx, /metrics, /prometheus). Any of these servlets can be enabled or disabled by the configuration property hbase.http.metrics.servlets. The value for the property should be a comma separated list of the servlet aliases which are {jmx, metrics, prometheus}. /jmx, /metrics, /prometheus are enabled by default. To get metrics using these servlets access the URL http://SERVER_HOSTNAME:SERVER_WEB_UI_PORT/endpoint. Where endpoint is one of /jmx, /metrics, or /prometheus. Eg. http://my.rs.xyz.com:16030/prometheus
Prometheus servlets
HBase exposes the metrics in prometheus friendly format through a servlet, /prometheus. Currently /prometheus exposes all the available metrics.
Discovering Available Metrics
Rather than listing each metric which HBase emits by default, you can browse through the available metrics, either as a JSON output or via JMX. Different metrics are exposed for the Master process and each region server process.
Procedure: Access a JSON Output of Available Metrics
After starting HBase, access the region server's web UI, at http://REGIONSERVER_HOSTNAME:16030 by default.
Click the Metrics Dump link near the top. The metrics for the region server are presented as a dump of the JMX bean in JSON format. This will dump out all metrics names and their values. To include metrics descriptions in the listing — this can be useful when you are exploring what is available — add a query string of ?description=true so your URL becomes http://REGIONSERVER_HOSTNAME:16030/jmx?description=true. Not all beans and attributes have descriptions.
To view metrics for the Master, connect to the Master's web UI instead (defaults to http://localhost:16010) and click its Metrics Dump link. To include metrics descriptions in the listing — this can be useful when you are exploring what is available — add a query string of ?description=true so your URL becomes http://REGIONSERVER_HOSTNAME:16010/jmx?description=true. Not all beans and attributes have descriptions.
You can use many different tools to view JMX content by browsing MBeans. This procedure uses jvisualvm, which is an application usually available in the JDK.
Procedure: Browse the JMX Output of Available Metrics
Start HBase, if it is not already running.
Run the command jvisualvm command on a host with a GUI display. You can launch it from the command line or another method appropriate for your operating system.
Be sure the VisualVM-MBeans plugin is installed. Browse to Tools → Plugins. Click Installed and check whether the plugin is listed. If not, click Available Plugins, select it, and click Install. When finished, click Close.
To view details for a given HBase process, double-click the process in the Local sub-tree in the left-hand panel. A detailed view opens in the right-hand panel. Click the MBeans tab which appears as a tab in the top of the right-hand panel.
To access the HBase metrics, navigate to the appropriate sub-bean: .* Master: .* RegionServer:
The name of each metric and its current value is displayed in the Attributes tab. For a view which includes more details, including the description of each attribute, click the Metadata tab.
Units of Measure for Metrics
Different metrics are expressed in different units, as appropriate. Often, the unit of measure is in the name (as in the metric shippedKBs). Otherwise, use the following guidelines. When in doubt, you may need to examine the source for a given metric.
- Metrics that refer to a point in time are usually expressed as a timestamp.
- Metrics that refer to an age (such as
ageOfLastShippedOp) are usually expressed in milliseconds. - Metrics that refer to memory sizes are in bytes.
- Sizes of queues (such as
sizeOfLogQueue) are expressed as the number of items in the queue. Determine the size by multiplying by the block size (default is 64 MB in HDFS). - Metrics that refer to things like the number of a given type of operations (such as
logEditsRead) are expressed as an integer.
Most Important Master Metrics
Note: Counts are usually over the last metrics reporting interval.
hbase.master.numRegionServers
Number of live regionservers
hbase.master.numDeadRegionServers
Number of dead regionservers
hbase.master.ritCount
The number of regions in transition
hbase.master.ritCountOverThreshold
The number of regions that have been in transition longer than a threshold time (default: 60 seconds)
hbase.master.ritOldestAge
The age of the longest region in transition, in milliseconds
Most Important RegionServer Metrics
Note: Counts are usually over the last metrics reporting interval.
hbase.regionserver.regionCount
The number of regions hosted by the regionserver
hbase.regionserver.storeFileCount
The number of store files on disk currently managed by the regionserver
hbase.regionserver.storeFileSize
Aggregate size of the store files on disk
hbase.regionserver.hlogFileCount
The number of write ahead logs not yet archived
hbase.regionserver.totalRequestCount
The total number of requests received
hbase.regionserver.readRequestCount
The number of read requests received
hbase.regionserver.writeRequestCount
The number of write requests received
hbase.regionserver.numOpenConnections
The number of open connections at the RPC layer
hbase.regionserver.numActiveHandler
The number of RPC handlers actively servicing requests
hbase.regionserver.numCallsInGeneralQueue
The number of currently enqueued user requests
hbase.regionserver.numCallsInReplicationQueue
The number of currently enqueued operations received from replication
hbase.regionserver.numCallsInPriorityQueue
The number of currently enqueued priority (internal housekeeping) requests
hbase.regionserver.flushQueueLength
Current depth of the memstore flush queue. If increasing, we are falling behind with clearing memstores out to HDFS.
hbase.regionserver.updatesBlockedTime
Number of milliseconds updates have been blocked so the memstore can be flushed
hbase.regionserver.compactionQueueLength
Current depth of the compaction request queue. If increasing, we are falling behind with storefile compaction.
hbase.regionserver.blockCacheHitCount
The number of block cache hits
hbase.regionserver.blockCacheMissCount
The number of block cache misses
hbase.regionserver.blockCacheExpressHitPercent
The percent of the time that requests with the cache turned on hit the cache
hbase.regionserver.percentFilesLocal
Percent of store file data that can be read from the local DataNode, 0-100
hbase.regionserver.<op>_<measure>
Operation latencies, where <op> is one of Append, Delete, Mutate, Get, Replay, Increment; and where <measure> is one of min, max, mean, median, 75th_percentile, 95th_percentile, 99th_percentile
hbase.regionserver.slow<op>Count
The number of operations we thought were slow, where <op> is one of the list above
hbase.regionserver.GcTimeMillis
Time spent in garbage collection, in milliseconds
hbase.regionserver.GcTimeMillisParNew
Time spent in garbage collection of the young generation, in milliseconds
hbase.regionserver.GcTimeMillisConcurrentMarkSweep
Time spent in garbage collection of the old generation, in milliseconds
hbase.regionserver.authenticationSuccesses
Number of client connections where authentication succeeded
hbase.regionserver.authenticationFailures
Number of client connection authentication failures
hbase.regionserver.mutationsWithoutWALCount
Count of writes submitted with a flag indicating they should bypass the write ahead log
Meta Table Load Metrics
HBase meta table metrics collection feature is available in HBase 1.4+ but it is disabled by default, as it can affect the performance of the cluster. When it is enabled, it helps to monitor client access patterns by collecting the following statistics:
- number of get, put and delete operations on the
hbase:metatable - number of get, put and delete operations made by the top-N clients
- number of operations related to each table
- number of operations related to the top-N regions
When to use the feature
This feature can help to identify hot spots in the meta table by showing the regions or tables where the meta info is modified (e.g. by create, drop, split or move tables) or retrieved most frequently. It can also help to find misbehaving client applications by showing which clients are using the meta table most heavily, which can for example suggest the lack of meta table buffering or the lack of re-using open client connections in the client application.
Possible side-effects of enabling this feature
Having large number of clients and regions in the cluster can cause the registration and tracking
of a large amount of metrics, which can increase the memory and CPU footprint of the HBase region
server handling the hbase:meta table. It can also cause the significant increase of the JMX dump
size, which can affect the monitoring or log aggregation system you use beside HBase. It is
recommended to turn on this feature only during debugging.
Where to find the metrics in JMX
Each metric attribute name will start with the ‘MetaTable_' prefix. For all the metrics you will see five different JMX attributes: count, mean rate, 1 minute rate, 5 minute rate and 15 minute rate. You will find these metrics in JMX under the following MBean: Hadoop → HBase → RegionServer → Coprocessor.Region.CP_org.apache.hadoop.hbase.coprocessor.MetaTableMetrics.
Examples: some Meta Table metrics you can see in your JMX dump
{
  "MetaTable_get_request_count": 77309,
  "MetaTable_put_request_mean_rate": 0.06339092997186495,
  "MetaTable_table_MyTestTable_request_15min_rate": 1.1020599841623246,
  "MetaTable_client_/172.30.65.42_lossy_request_count": 1786
  "MetaTable_client_/172.30.65.45_put_request_5min_rate": 0.6189810954855728,
  "MetaTable_region_1561131112259.c66e4308d492936179352c80432ccfe0._lossy_request_count": 38342,
  "MetaTable_region_1561131043640.5bdffe4b9e7e334172065c853cf0caa6._lossy_request_1min_rate": 0.04925099917433935,
}
Configuration
To turn on this feature, you have to enable a custom coprocessor by adding the following section to hbase-site.xml. This coprocessor will run on all the HBase RegionServers, but will be active (i.e. consume memory / CPU) only on the server, where the hbase:meta table is located. It will produce JMX metrics which can be downloaded from the web UI of the given RegionServer or by a simple REST call. These metrics will not be present in the JMX dump of the other RegionServers.
Enabling the Meta Table Metrics feature
<property>
    <name>hbase.coprocessor.region.classes</name>
    <value>org.apache.hadoop.hbase.coprocessor.MetaTableMetrics</value>
</property>
How the top-N metrics are calculated?
The 'top-N' type of metrics will be counted using the Lossy Counting Algorithm (as defined in Motwani, R; Manku, G.S (2002). "Approximate frequency counts over data streams"), which is designed to identify elements in a data stream whose frequency count exceed a user-given threshold. The frequency computed by this algorithm is not always accurate but has an error threshold that can be specified by the user as a configuration parameter. The run time space required by the algorithm is inversely proportional to the specified error threshold, hence larger the error parameter, the smaller the footprint and the less accurate are the metrics.
You can specify the error rate of the algorithm as a floating-point value between 0 and 1 (exclusive), it's default value is 0.02. Having the error rate set to E and having N as the total number of meta table operations, then (assuming the uniform distribution of the activity of low frequency elements) at most 7 / E meters will be kept and each kept element will have a frequency higher than E * N.
An example: Let's assume we are interested in the HBase clients that are most active in accessing the meta table. When there was 1,000,000 operations on the meta table so far and the error rate parameter is set to 0.02, then we can assume that only at most 350 client IP address related counters will be present in JMX and each of these clients accessed the meta table at least 20,000 times.
<property>
    <name>hbase.util.default.lossycounting.errorrate</name>
    <value>0.02</value>
</property>
HBase Monitoring
Overview
The following metrics are arguably the most important to monitor for each RegionServer for "macro monitoring", preferably with a system like OpenTSDB. If your cluster is having performance issues it's likely that you'll see something unusual with this group.
HBase
- See rs metrics
OS
- IO Wait
- User CPU
Java
- GC
Slow Query Log
The HBase slow query log consists of parseable JSON structures describing the properties of those client operations (Gets, Puts, Deletes, etc.) that either took too long to run, or produced too much output. The thresholds for "too long to run" and "too much output" are configurable, as described below. The output is produced inline in the main region server logs so that it is easy to discover further details from context with other logged events. It is also prepended with identifying tags (responseTooSlow), (responseTooLarge), (operationTooSlow), and (operationTooLarge) in order to enable easy filtering with grep, in case the user desires to see only slow queries.
Configuration
There are four configuration knobs that can be used to adjust the thresholds for when queries are logged. Two of these knobs control the size and time thresholds for all queries. Because Scans can often be larger and slower than other types of queries, there are two additional knobs which can control size and time thresholds for Scans specifically.
hbase.ipc.warn.response.timeMaximum number of milliseconds that a query can be run without being logged. Defaults to 10000, or 10 seconds. Can be set to -1 to disable logging by time.hbase.ipc.warn.response.sizeMaximum byte size of response that a query can return without being logged. Defaults to 100 megabytes. Can be set to -1 to disable logging by size.hbase.ipc.warn.response.time.scanMaximum number of milliseconds that a Scan can be run without being logged. Defaults to thehbase.ipc.warn.response.timevalue. Can be set to -1 to disable logging by time.hbase.ipc.warn.response.size.scanMaximum byte size of response that a Scan can return without being logged. Defaults to thehbase.ipc.warn.response.sizevalue. Can be set to -1 to disable logging by size.
Metrics
The slow query log exposes to metrics to JMX.
hadoop.regionserver_rpc_slowResponsea global metric reflecting the durations of all responses that triggered logging.hadoop.regionserver_rpc_methodName.aboveOneSecA metric reflecting the durations of all responses that lasted for more than one second.
Output
The output is tagged with operation e.g. (operationTooSlow) if the call was a client operation, such as a Put, Get, or Delete, which we expose detailed fingerprint information for. If not, it is tagged (responseTooSlow) and still produces parseable JSON output, but with less verbose information solely regarding its duration and size in the RPC itself. TooLarge is substituted for TooSlow if the response size triggered the logging, with TooLarge appearing even in the case that both size and duration triggered logging.
Example
2011-09-08 10:01:25,824 WARN org.apache.hadoop.ipc.HBaseServer: (operationTooSlow): {"tables":{"riley2":{"puts":[{"totalColumns":11,"families":{"actions":[{"timestamp":1315501284459,"qualifier":"0","vlen":9667580},{"timestamp":1315501284459,"qualifier":"1","vlen":10122412},{"timestamp":1315501284459,"qualifier":"2","vlen":11104617},{"timestamp":1315501284459,"qualifier":"3","vlen":13430635}]},"row":"cfcd208495d565ef66e7dff9f98764da:0"}],"families":["actions"]}},"processingtimems":956,"client":"10.47.34.63:33623","starttimems":1315501284456,"queuetimems":0,"totalPuts":1,"class":"HRegionServer","responsesize":0,"method":"multiPut"}Note that everything inside the "tables" structure is output produced by MultiPut's fingerprint, while the rest of the information is RPC-specific, such as processing time and client IP/port. Other client operations follow the same pattern and the same general structure, with necessary differences due to the nature of the individual operations. In the case that the call is not a client operation, that detailed fingerprint information will be completely absent.
This particular example, for example, would indicate that the likely cause of slowness is simply a very large (on the order of 100MB) multiput, as we can tell by the "vlen," or value length, fields of each put in the multiPut.
Get Slow Response Log from shell
When an individual RPC exceeds a configurable time bound we log a complaint by way of the logging subsystem
e.g.
2019-10-02 10:10:22,195 WARN [,queue=15,port=60020] ipc.RpcServer - (responseTooSlow):
{"call":"Scan(org.apache.hadoop.hbase.protobuf.generated.ClientProtos$ScanRequest)",
"starttimems":1567203007549,
"responsesize":6819737,
"method":"Scan",
"param":"region { type: REGION_NAME value: \"t1,\\000\\000\\215\\f)o\\\\\\024\\302\\220\\000\\000\\000\\000\\000\\001\\000\\000\\000\\000\\000\\006\\000\\000\\000\\000\\000\\005\\000\\000<TRUNCATED>",
"processingtimems":28646,
"client":"10.253.196.215:41116",
"queuetimems":22453,
"class":"HRegionServer"}
Unfortunately often the request parameters are truncated as per above Example. The truncation is unfortunate because it eliminates much of the utility of the warnings. For example, the region name, the start and end keys, and the filter hierarchy are all important clues for debugging performance problems caused by moderate to low selectivity queries or queries made at a high rate.
HBASE-22978 introduces maintaining an in-memory ring buffer of requests that were judged to be too slow in addition to the responseTooSlow logging. The in-memory representation can be complete. There is some chance a high rate of requests will cause information on other interesting requests to be overwritten before it can be read. This is an acceptable trade off.
In order to enable the in-memory ring buffer at RegionServers, we need to enable config:
hbase.regionserver.slowlog.buffer.enabledOne more config determines the size of the ring buffer:
hbase.regionserver.slowlog.ringbuffer.sizeCheck the config section for the detailed description.
This config would be disabled by default. Turn it on and these shell commands would provide expected results from the ring-buffers.
shell commands to retrieve slowlog responses from RegionServers:
Retrieve latest SlowLog Responses maintained by each or specific RegionServers.
Specify '*' to include all RS otherwise array of server names for specific
RS. A server name is the host, port plus startcode of a RegionServer.
e.g.: host187.example.com,60020,1289493121758 (find servername in
master ui or when you do detailed status in shell)

Provide optional filter parameters as Hash.
Default Limit of each server for providing no of slow log records is 10. User can specify
more limit by 'LIMIT' param in case more than 10 records should be retrieved.

Examples:

  hbase> get_slowlog_responses '*'                                 => get slowlog responses from all RS
  hbase> get_slowlog_responses '*', {'LIMIT' => 50}                => get slowlog responses from all RS
                                                                      with 50 records limit (default limit: 10)
  hbase> get_slowlog_responses ['SERVER_NAME1', 'SERVER_NAME2']    => get slowlog responses from SERVER_NAME1,
                                                                      SERVER_NAME2
  hbase> get_slowlog_responses '*', {'REGION_NAME' => 'hbase:meta,,1'}
                                                                   => get slowlog responses only related to meta
                                                                      region
  hbase> get_slowlog_responses '*', {'TABLE_NAME' => 't1'}         => get slowlog responses only related to t1 table
  hbase> get_slowlog_responses '*', {'CLIENT_IP' => '192.162.1.40:60225', 'LIMIT' => 100}
                                                                   => get slowlog responses with given client
                                                                      IP address and get 100 records limit
                                                                      (default limit: 10)
  hbase> get_slowlog_responses '*', {'REGION_NAME' => 'hbase:meta,,1', 'TABLE_NAME' => 't1'}
                                                                   => get slowlog responses with given region name
                                                                      or table name
  hbase> get_slowlog_responses '*', {'USER' => 'user_name', 'CLIENT_IP' => '192.162.1.40:60225'}
                                                                   => get slowlog responses that match either
                                                                      provided client IP address or user name
All of above queries with filters have default OR operation applied i.e. all records with any of the provided filters applied will be returned. However, we can also apply AND operator i.e. all records that match all (not any) of the provided filters should be returned.
  hbase> get_slowlog_responses '*', {'REGION_NAME' => 'hbase:meta,,1', 'TABLE_NAME' => 't1', 'FILTER_BY_OP' => 'AND'}
                                                                   => get slowlog responses with given region name
                                                                      and table name, both should match

  hbase> get_slowlog_responses '*', {'REGION_NAME' => 'hbase:meta,,1', 'TABLE_NAME' => 't1', 'FILTER_BY_OP' => 'OR'}
                                                                   => get slowlog responses with given region name
                                                                      or table name, any one can match

  hbase> get_slowlog_responses '*', {'TABLE_NAME' => 't1', 'CLIENT_IP' => '192.163.41.53:52781', 'FILTER_BY_OP' => 'AND'}
                                                                   => get slowlog responses with given region name
                                                                      and client IP address, both should match
Since OR is the default filter operator, without providing 'FILTER_BY_OP', query will have same result as providing 'FILTER_BY_OP' ⇒ 'OR'.
Sometimes output can be long pretty printed json for user to scroll in a single screen and hence user might prefer redirecting output of get_slowlog_responses to a file.
Example:
echo "get_slowlog_responses '*'" | hbase shell > xyz.out 2>&1Similar to slow RPC logs, client can also retrieve large RPC logs. Sometimes, slow logs important to debug perf issues turn out to be larger in size.
  hbase> get_largelog_responses '*'                                 => get largelog responses from all RS
  hbase> get_largelog_responses '*', {'LIMIT' => 50}                => get largelog responses from all RS
                                                                       with 50 records limit (default limit: 10)
  hbase> get_largelog_responses ['SERVER_NAME1', 'SERVER_NAME2']    => get largelog responses from SERVER_NAME1,
                                                                       SERVER_NAME2
  hbase> get_largelog_responses '*', {'REGION_NAME' => 'hbase:meta,,1'}
                                                                    => get largelog responses only related to meta
                                                                       region
  hbase> get_largelog_responses '*', {'TABLE_NAME' => 't1'}         => get largelog responses only related to t1 table
  hbase> get_largelog_responses '*', {'CLIENT_IP' => '192.162.1.40:60225', 'LIMIT' => 100}
                                                                    => get largelog responses with given client
                                                                       IP address and get 100 records limit
                                                                       (default limit: 10)
  hbase> get_largelog_responses '*', {'REGION_NAME' => 'hbase:meta,,1', 'TABLE_NAME' => 't1'}
                                                                    => get largelog responses with given region name
                                                                       or table name
  hbase> get_largelog_responses '*', {'USER' => 'user_name', 'CLIENT_IP' => '192.162.1.40:60225'}
                                                                    => get largelog responses that match either
                                                                       provided client IP address or user name

  hbase> get_largelog_responses '*', {'REGION_NAME' => 'hbase:meta,,1', 'TABLE_NAME' => 't1', 'FILTER_BY_OP' => 'AND'}
                                                                   => get largelog responses with given region name
                                                                      and table name, both should match

  hbase> get_largelog_responses '*', {'REGION_NAME' => 'hbase:meta,,1', 'TABLE_NAME' => 't1', 'FILTER_BY_OP' => 'OR'}
                                                                   => get largelog responses with given region name
                                                                      or table name, any one can match

  hbase> get_largelog_responses '*', {'TABLE_NAME' => 't1', 'CLIENT_IP' => '192.163.41.53:52781', 'FILTER_BY_OP' => 'AND'}
                                                                   => get largelog responses with given region name
                                                                      and client IP address, both should match
shell command to clear slow/largelog responses from RegionServer:
Clears SlowLog Responses maintained by each or specific RegionServers.
Specify array of server names for specific RS. A server name is
the host, port plus startcode of a RegionServer.
e.g.: host187.example.com,60020,1289493121758 (find servername in
master ui or when you do detailed status in shell)

Examples:

  hbase> clear_slowlog_responses                                     => clears slowlog responses from all RS
  hbase> clear_slowlog_responses ['SERVER_NAME1', 'SERVER_NAME2']    => clears slowlog responses from SERVER_NAME1,
                                                                        SERVER_NAME2
Get Slow/Large Response Logs from System table hbase:slowlog
The above section provides details about Admin APIs:
- get_slowlog_responses
- get_largelog_responses
- clear_slowlog_responses
All of the above APIs access online in-memory ring buffers from individual RegionServers and accumulate logs from ring buffers to display to end user. However, since the logs are stored in memory, after RegionServer is restarted, all the objects held in memory of that RegionServer will be cleaned up and previous logs are lost. What if we want to persist all these logs forever? What if we want to store them in such a manner that operator can get all historical records with some filters? e.g get me all large/slow RPC logs that are triggered by user1 and are related to region: cluster_test,cccccccc,1589635796466.aa45e1571d533f5ed0bb31cdccaaf9cf. ?
If we have a system table that stores such logs in increasing (not so strictly though) order of time, it can definitely help operators debug some historical events (scan, get, put, compaction, flush etc) with detailed inputs.
Config which enabled system table to be created and store all log events is hbase.regionserver.slowlog.systable.enabled.
The default value for this config is false. If provided true (Note: hbase.regionserver.slowlog.buffer.enabled should also be true), a cron job running in every RegionServer will persist the slow/large logs into table hbase:slowlog. By default cron job runs every 10 min. Duration can be configured with key: hbase.slowlog.systable.chore.duration. By default, RegionServer will store upto 1000(config key: hbase.regionserver.slowlog.systable.queue.size) slow/large logs in an internal queue and the chore will retrieve these logs from the queue and perform batch insertion in hbase:slowlog.
hbase:slowlog has single ColumnFamily: info info contains multiple qualifiers which are the same attributes present as part of get_slowlog_responses API response.
- info:call_details
- info:client_address
- info:method_name
- info:param
- info:processing_time
- info:queue_time
- info:region_name
- info:response_size
- info:server_class
- info:start_time
- info:type
- info:username
And example of 2 rows from hbase:slowlog scan result:
 \x024\xC1\x03\xE9\x04\xF5@                                  column=info:call_details, timestamp=2020-05-16T14:58:14.211Z, value=Scan(org.apache.hadoop.hbase.shaded.protobuf.generated.ClientProtos$ScanRequest)
 \x024\xC1\x03\xE9\x04\xF5@                                  column=info:client_address, timestamp=2020-05-16T14:58:14.211Z, value=172.20.10.2:57347
 \x024\xC1\x03\xE9\x04\xF5@                                  column=info:method_name, timestamp=2020-05-16T14:58:14.211Z, value=Scan
 \x024\xC1\x03\xE9\x04\xF5@                                  column=info:param, timestamp=2020-05-16T14:58:14.211Z, value=region { type: REGION_NAME value: "hbase:meta,,1" } scan { column { family: "info" } attribute { name: "_isolationle
                                                             vel_" value: "\x5C000" } start_row: "cluster_test,33333333,99999999999999" stop_row: "cluster_test,," time_range { from: 0 to: 9223372036854775807 } max_versions: 1 cache_blocks
                                                             : true max_result_size: 2097152 reversed: true caching: 10 include_stop_row: true readType: PREAD } number_of_rows: 10 close_scanner: false client_handles_partials: true client_
                                                             handles_heartbeats: true track_scan_metrics: false
 \x024\xC1\x03\xE9\x04\xF5@                                  column=info:processing_time, timestamp=2020-05-16T14:58:14.211Z, value=18
 \x024\xC1\x03\xE9\x04\xF5@                                  column=info:queue_time, timestamp=2020-05-16T14:58:14.211Z, value=0
 \x024\xC1\x03\xE9\x04\xF5@                                  column=info:region_name, timestamp=2020-05-16T14:58:14.211Z, value=hbase:meta,,1
 \x024\xC1\x03\xE9\x04\xF5@                                  column=info:response_size, timestamp=2020-05-16T14:58:14.211Z, value=1575
 \x024\xC1\x03\xE9\x04\xF5@                                  column=info:server_class, timestamp=2020-05-16T14:58:14.211Z, value=HRegionServer
 \x024\xC1\x03\xE9\x04\xF5@                                  column=info:start_time, timestamp=2020-05-16T14:58:14.211Z, value=1589640743732
 \x024\xC1\x03\xE9\x04\xF5@                                  column=info:type, timestamp=2020-05-16T14:58:14.211Z, value=ALL
 \x024\xC1\x03\xE9\x04\xF5@                                  column=info:username, timestamp=2020-05-16T14:58:14.211Z, value=user2
 \x024\xC1\x06X\x81\xF6\xEC                                  column=info:call_details, timestamp=2020-05-16T14:59:58.764Z, value=Scan(org.apache.hadoop.hbase.shaded.protobuf.generated.ClientProtos$ScanRequest)
 \x024\xC1\x06X\x81\xF6\xEC                                  column=info:client_address, timestamp=2020-05-16T14:59:58.764Z, value=172.20.10.2:57348
 \x024\xC1\x06X\x81\xF6\xEC                                  column=info:method_name, timestamp=2020-05-16T14:59:58.764Z, value=Scan
 \x024\xC1\x06X\x81\xF6\xEC                                  column=info:param, timestamp=2020-05-16T14:59:58.764Z, value=region { type: REGION_NAME value: "cluster_test,cccccccc,1589635796466.aa45e1571d533f5ed0bb31cdccaaf9cf." } scan { a
                                                             ttribute { name: "_isolationlevel_" value: "\x5C000" } start_row: "cccccccc" time_range { from: 0 to: 9223372036854775807 } max_versions: 1 cache_blocks: true max_result_size: 2
                                                             097152 caching: 2147483647 include_stop_row: false } number_of_rows: 2147483647 close_scanner: false client_handles_partials: true client_handles_heartbeats: true track_scan_met
                                                             rics: false
 \x024\xC1\x06X\x81\xF6\xEC                                  column=info:processing_time, timestamp=2020-05-16T14:59:58.764Z, value=24
 \x024\xC1\x06X\x81\xF6\xEC                                  column=info:queue_time, timestamp=2020-05-16T14:59:58.764Z, value=0
 \x024\xC1\x06X\x81\xF6\xEC                                  column=info:region_name, timestamp=2020-05-16T14:59:58.764Z, value=cluster_test,cccccccc,1589635796466.aa45e1571d533f5ed0bb31cdccaaf9cf.
 \x024\xC1\x06X\x81\xF6\xEC                                  column=info:response_size, timestamp=2020-05-16T14:59:58.764Z, value=211227
 \x024\xC1\x06X\x81\xF6\xEC                                  column=info:server_class, timestamp=2020-05-16T14:59:58.764Z, value=HRegionServer
 \x024\xC1\x06X\x81\xF6\xEC                                  column=info:start_time, timestamp=2020-05-16T14:59:58.764Z, value=1589640743932
 \x024\xC1\x06X\x81\xF6\xEC                                  column=info:type, timestamp=2020-05-16T14:59:58.764Z, value=ALL
 \x024\xC1\x06X\x81\xF6\xEC                                  column=info:username, timestamp=2020-05-16T14:59:58.764Z, value=user1
Operator can use ColumnValueFilter to filter records based on region_name, username, client_address etc.
Time range based queries will also be very useful. Example:
scan 'hbase:slowlog', { TIMERANGE => [1589621394000, 1589637999999] }Block Cache Monitoring
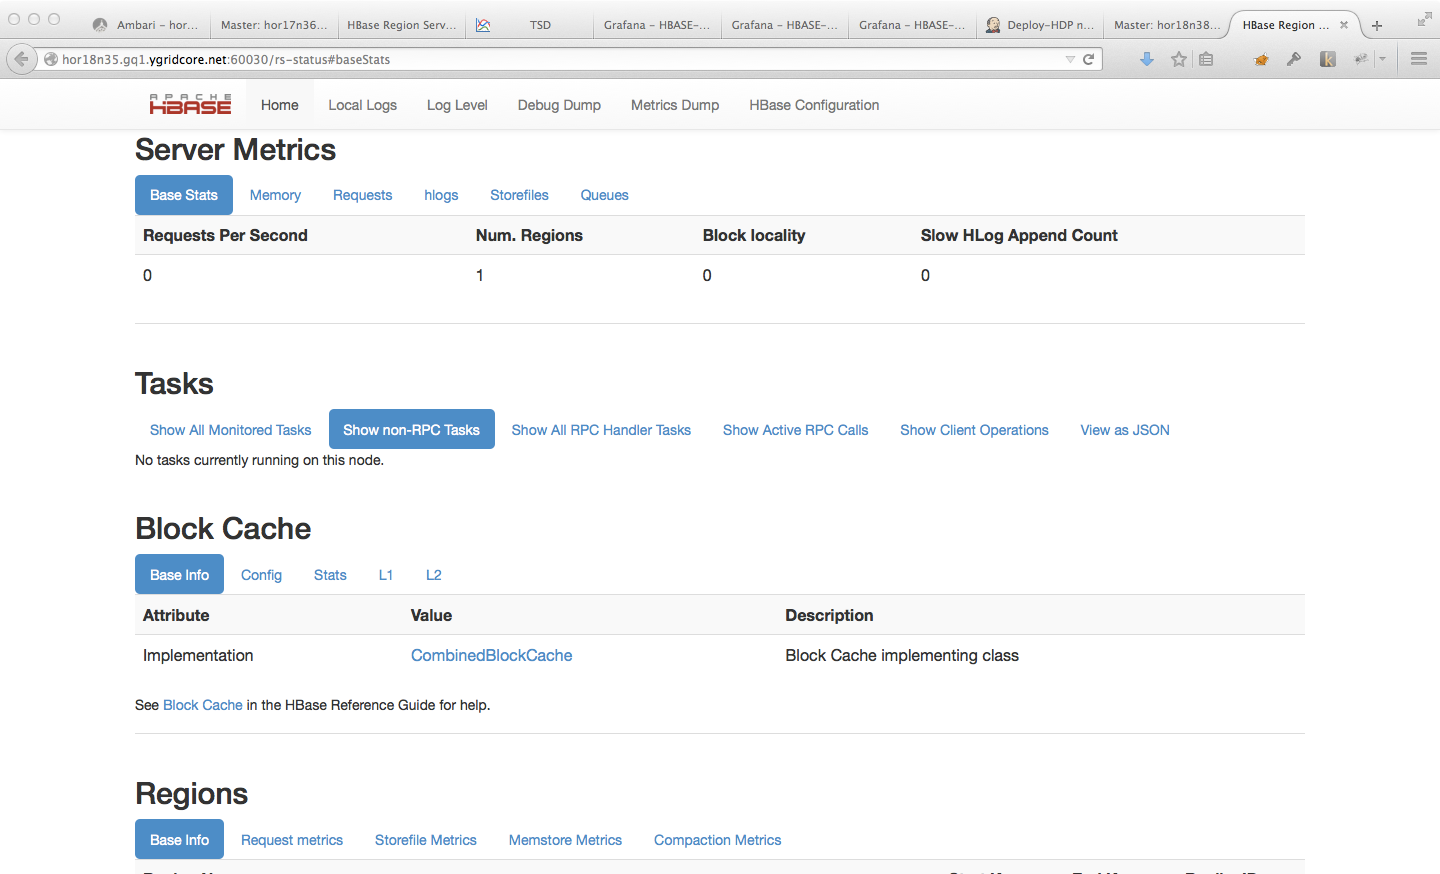
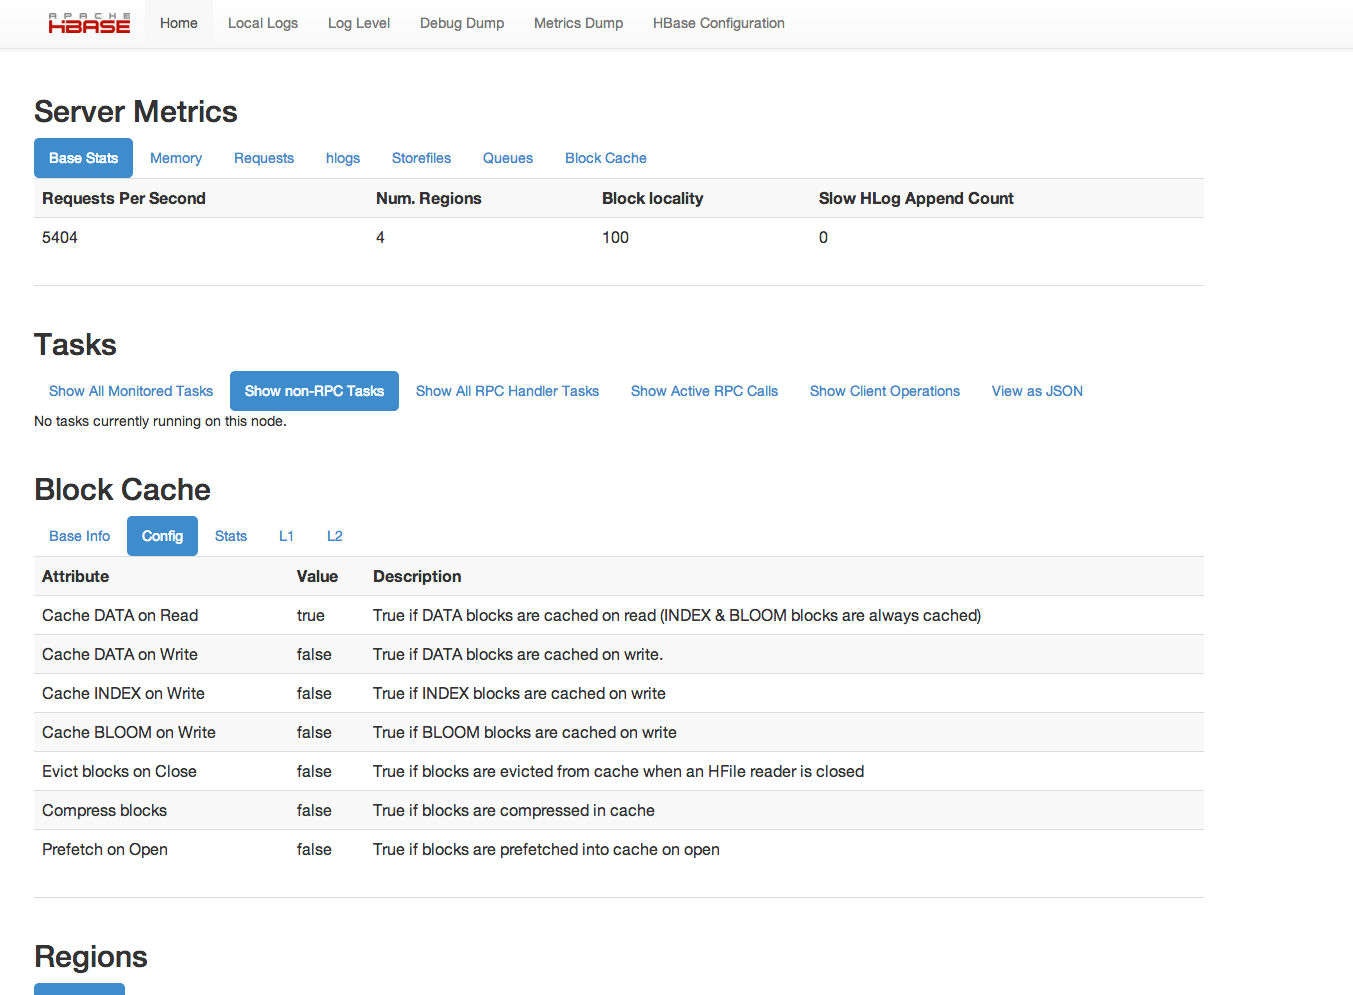
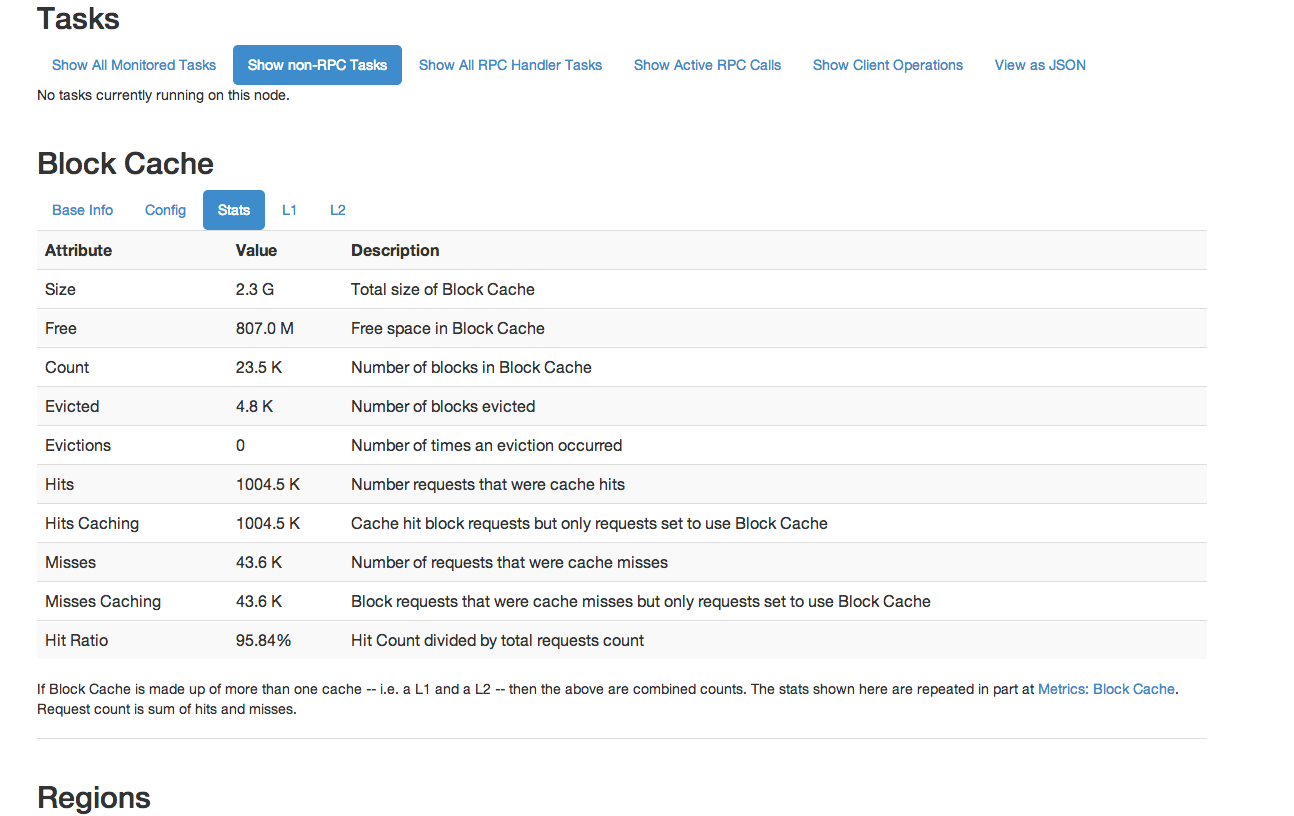
Starting with HBase 0.98, the HBase Web UI includes the ability to monitor and report on the performance of the block cache. To view the block cache reports, see the Block Cache section of the region server UI. Following are a few examples of the reporting capabilities.
Basic Info shows the cache implementation.
Config shows all cache configuration options.
Stats shows statistics about the performance of the cache.
L1 and L2 show information about the L1 and L2 caches.
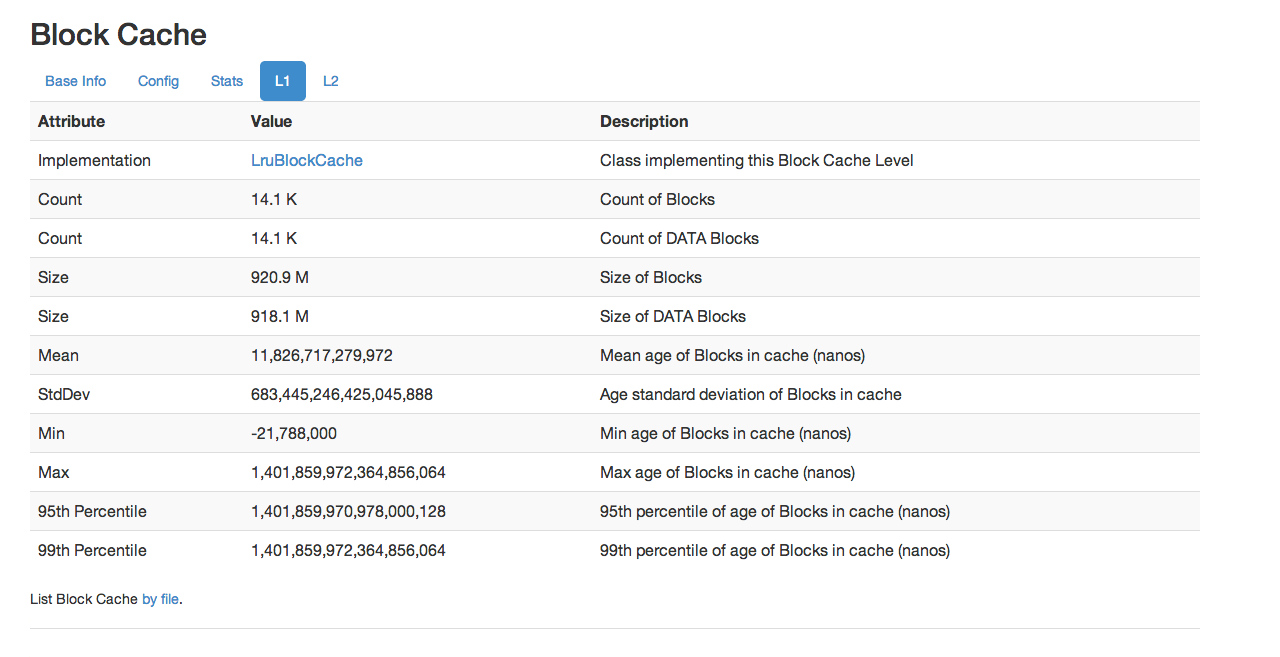
This is not an exhaustive list of all the screens and reports available. Have a look in the Web UI.
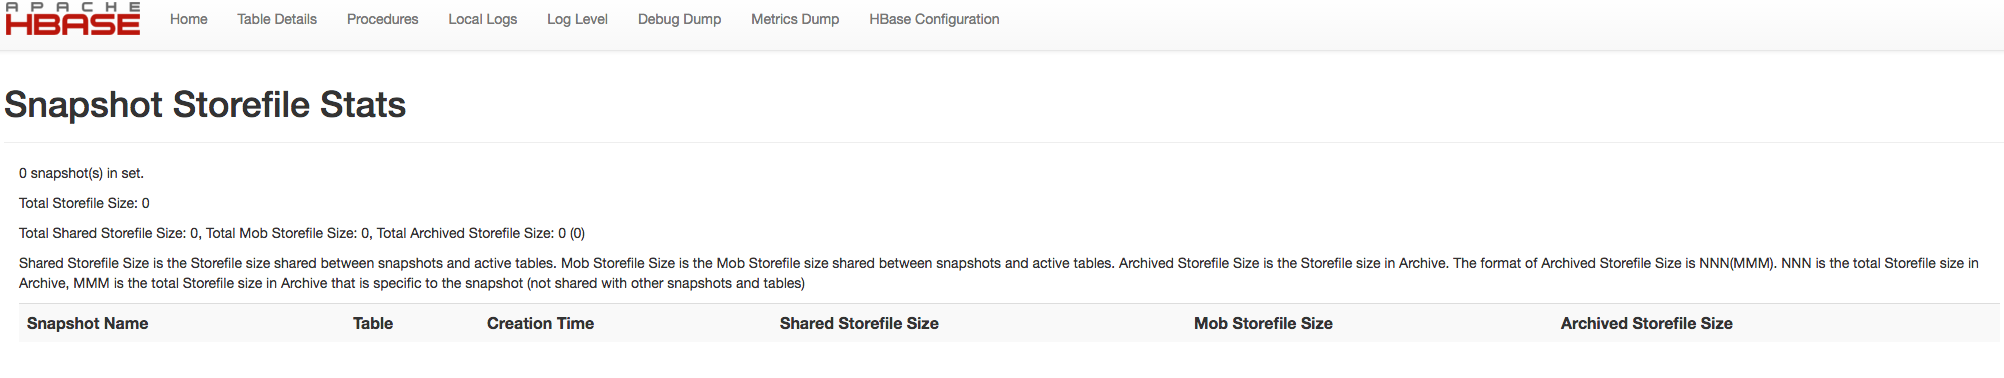
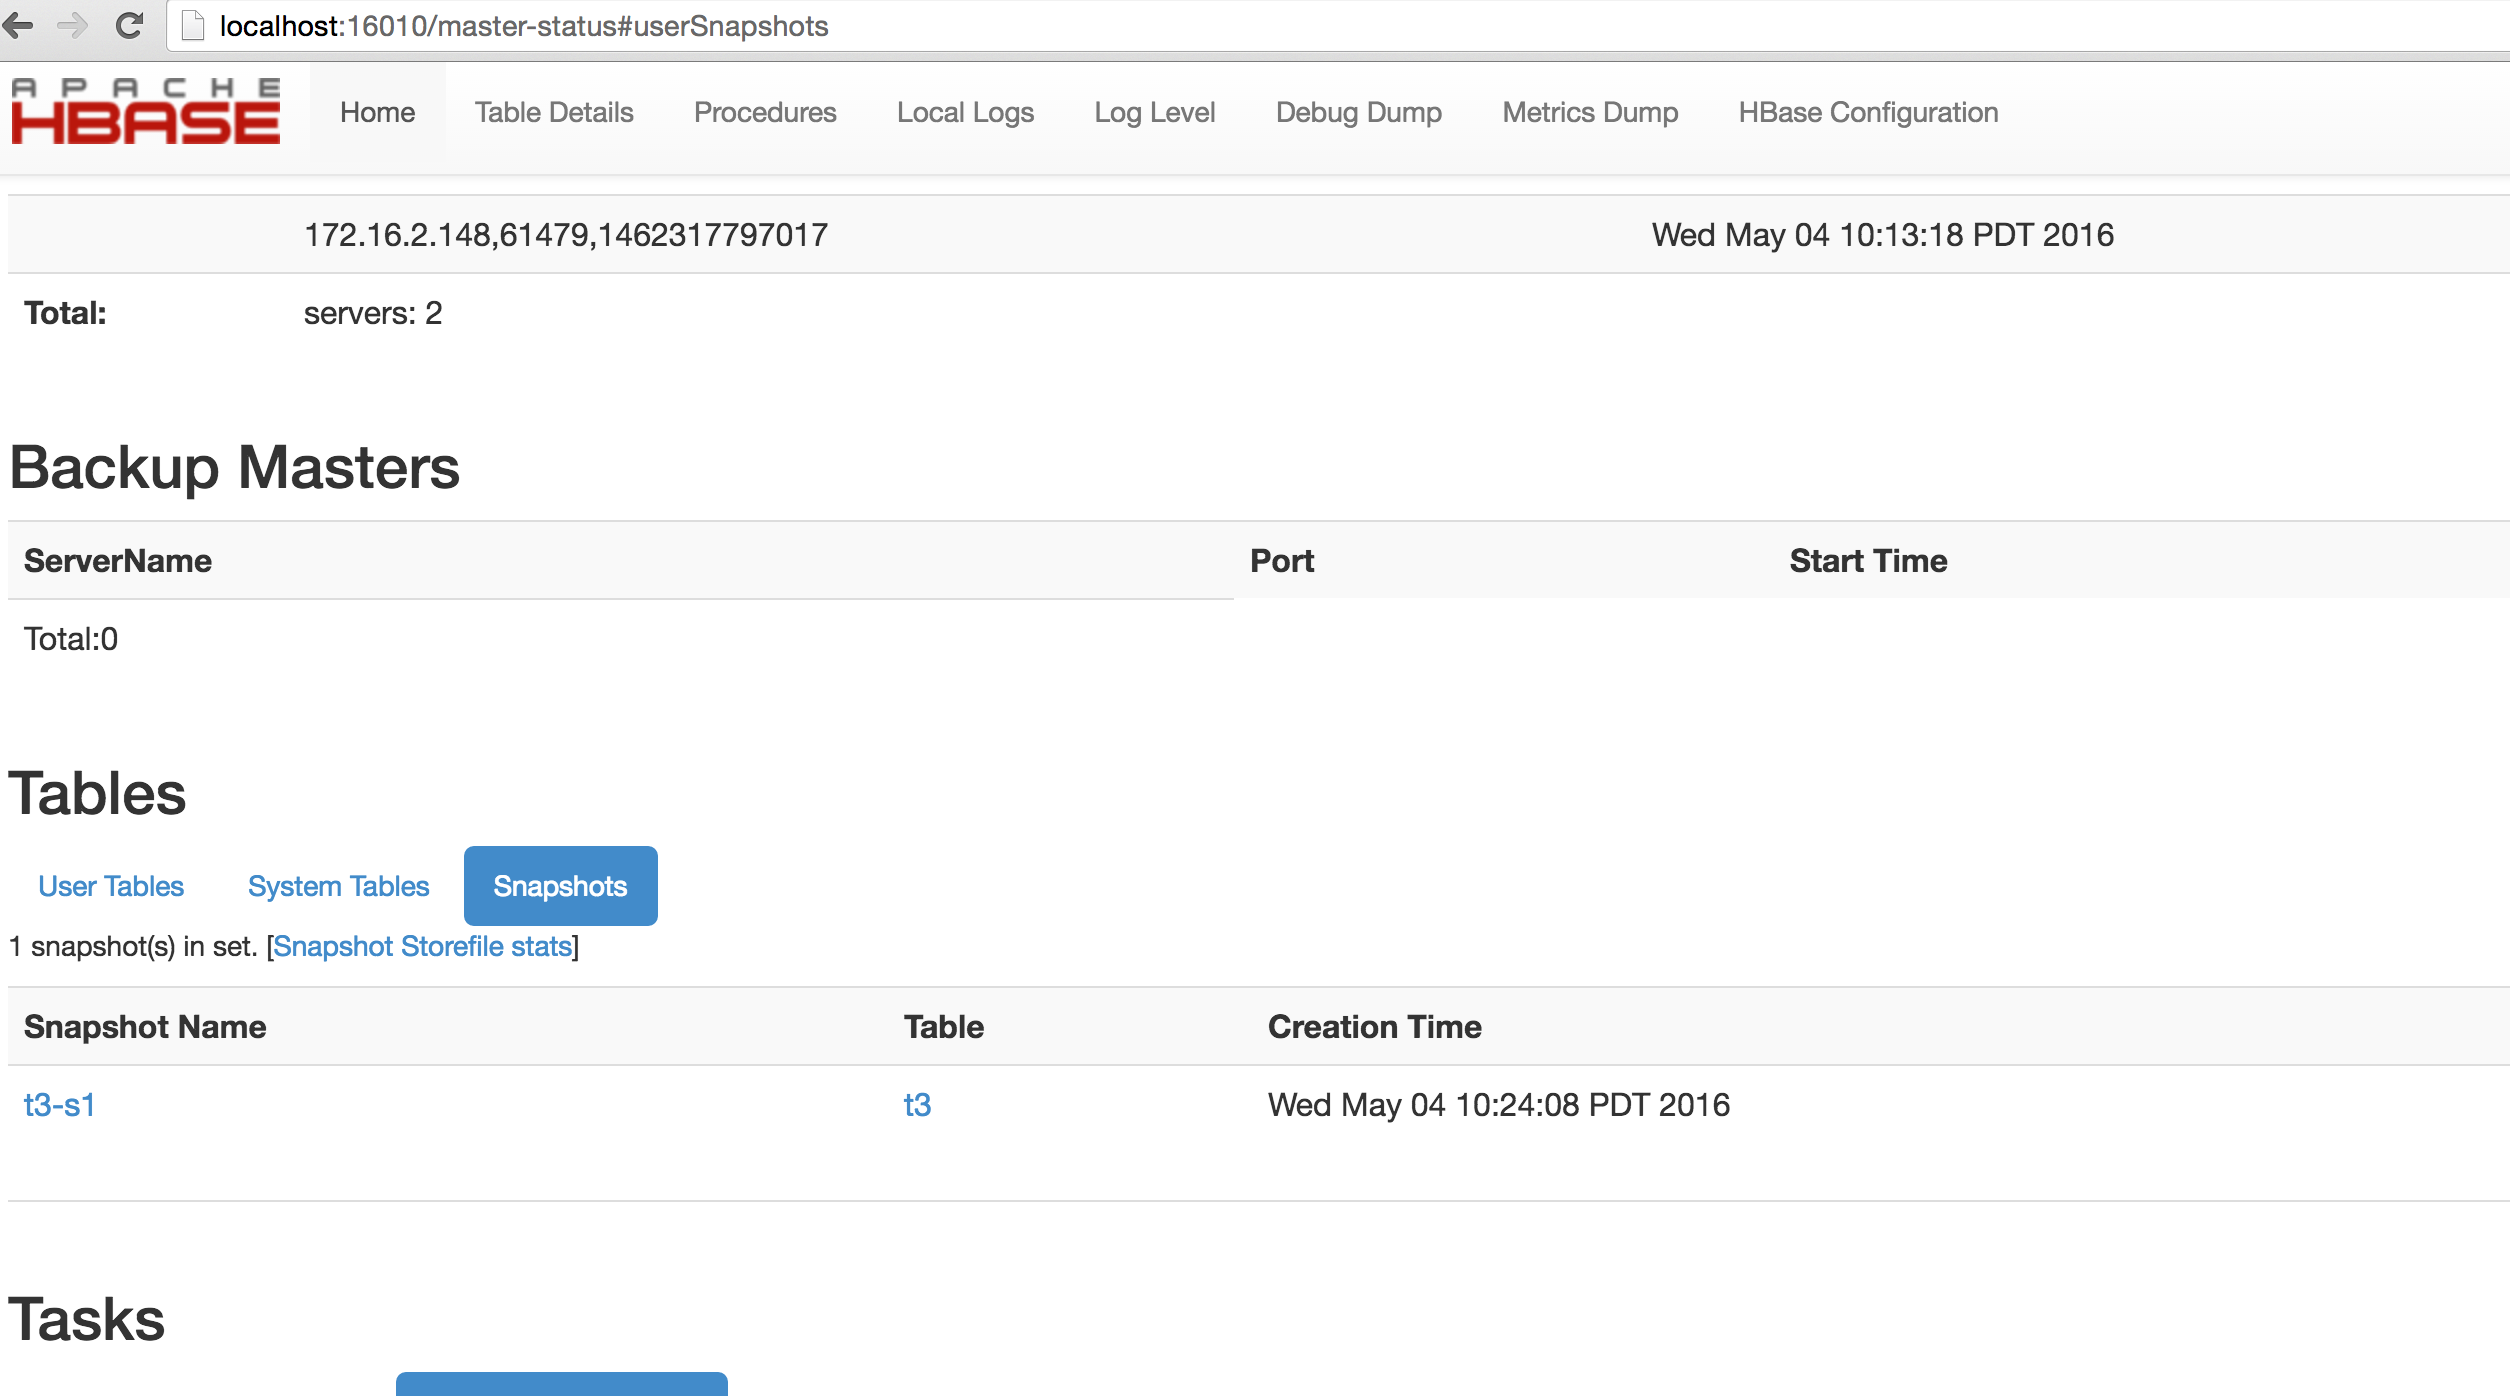
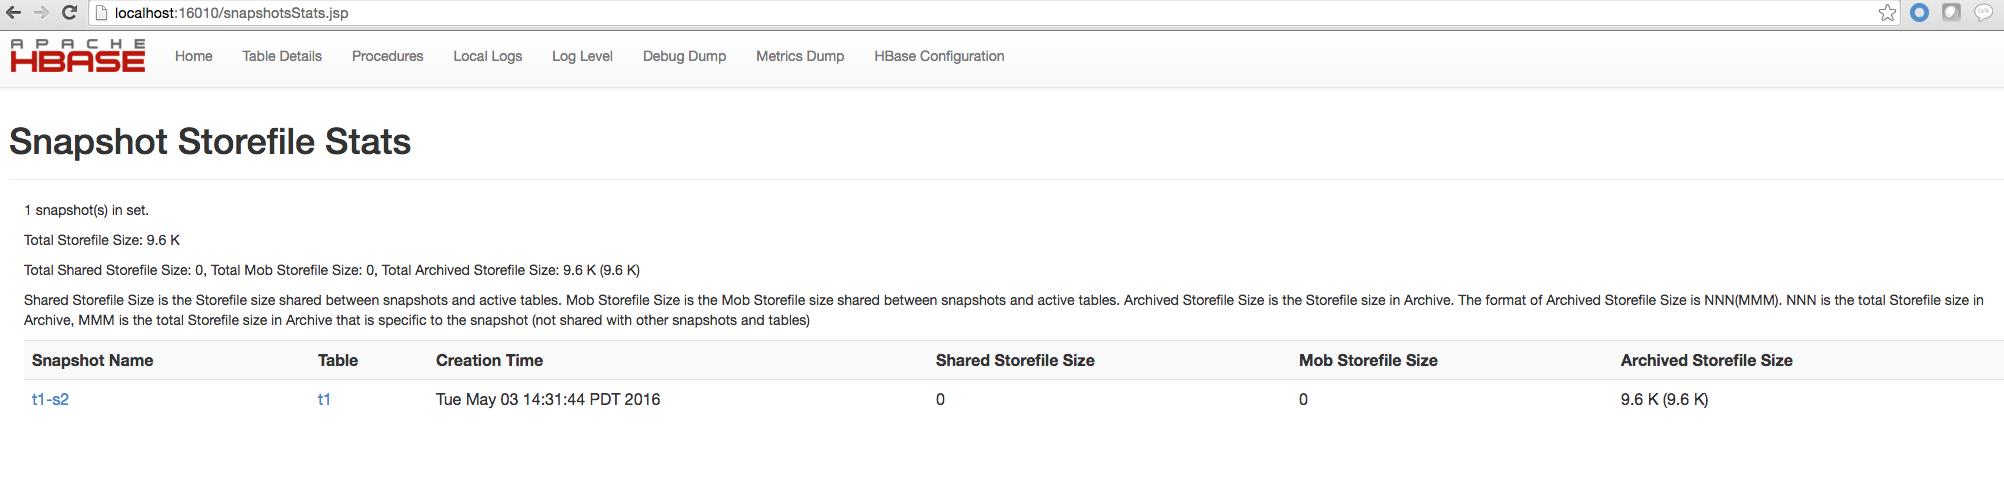
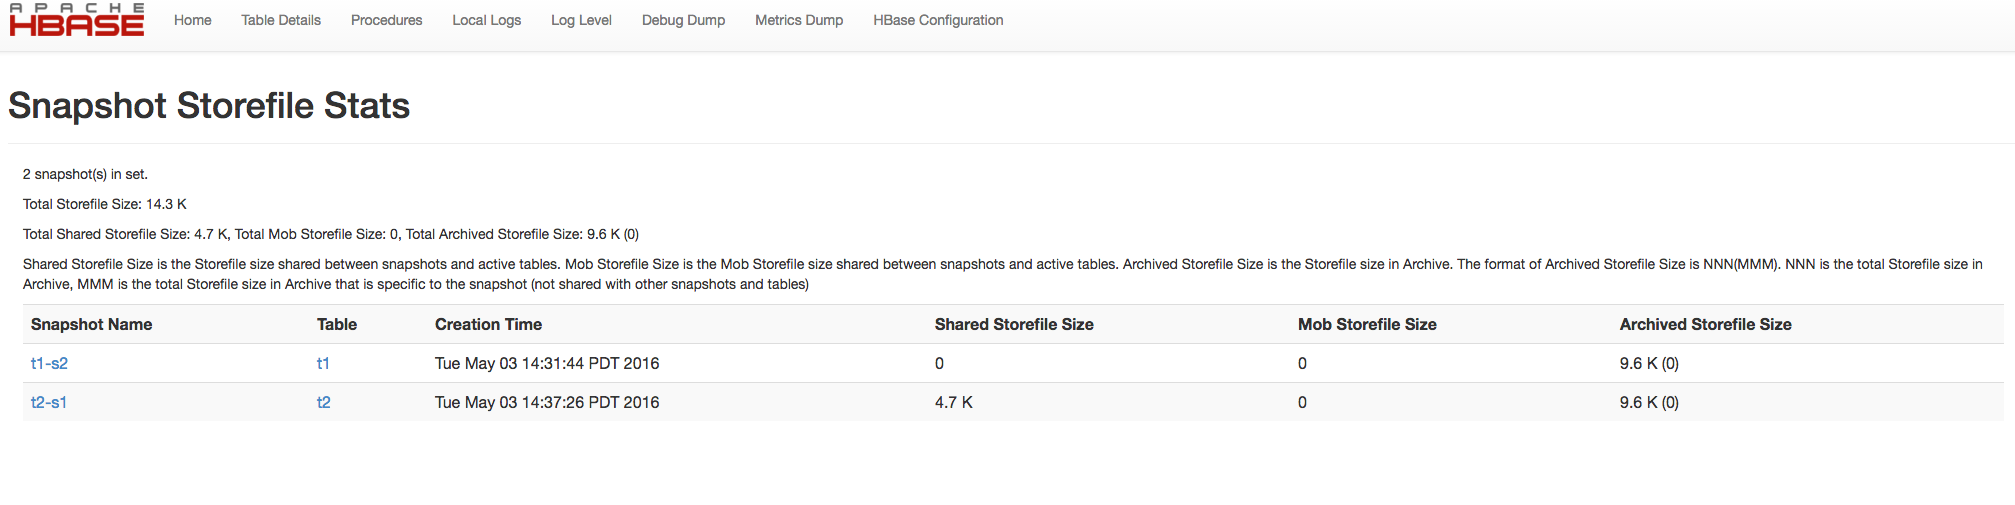
Snapshot Space Usage Monitoring
Starting with HBase 0.95, Snapshot usage information on individual snapshots was shown in the HBase Master Web UI. This was further enhanced starting with HBase 1.3 to show the total Storefile size of the Snapshot Set. The following metrics are shown in the Master Web UI with HBase 1.3 and later.
- Shared Storefile Size is the Storefile size shared between snapshots and active tables.
- Mob Storefile Size is the Mob Storefile size shared between snapshots and active tables.
- Archived Storefile Size is the Storefile size in Archive.
The format of Archived Storefile Size is NNN(MMM). NNN is the total Storefile size in Archive, MMM is the total Storefile size in Archive that is specific to the snapshot (not shared with other snapshots and tables).
Master Snapshot Overview
Snapshot Storefile Stats Example 1
Snapshot Storefile Stats Example 2
Empty Snapshot Storfile Stats Example